Dashboard Tour
Common Features
Dark/light theme support
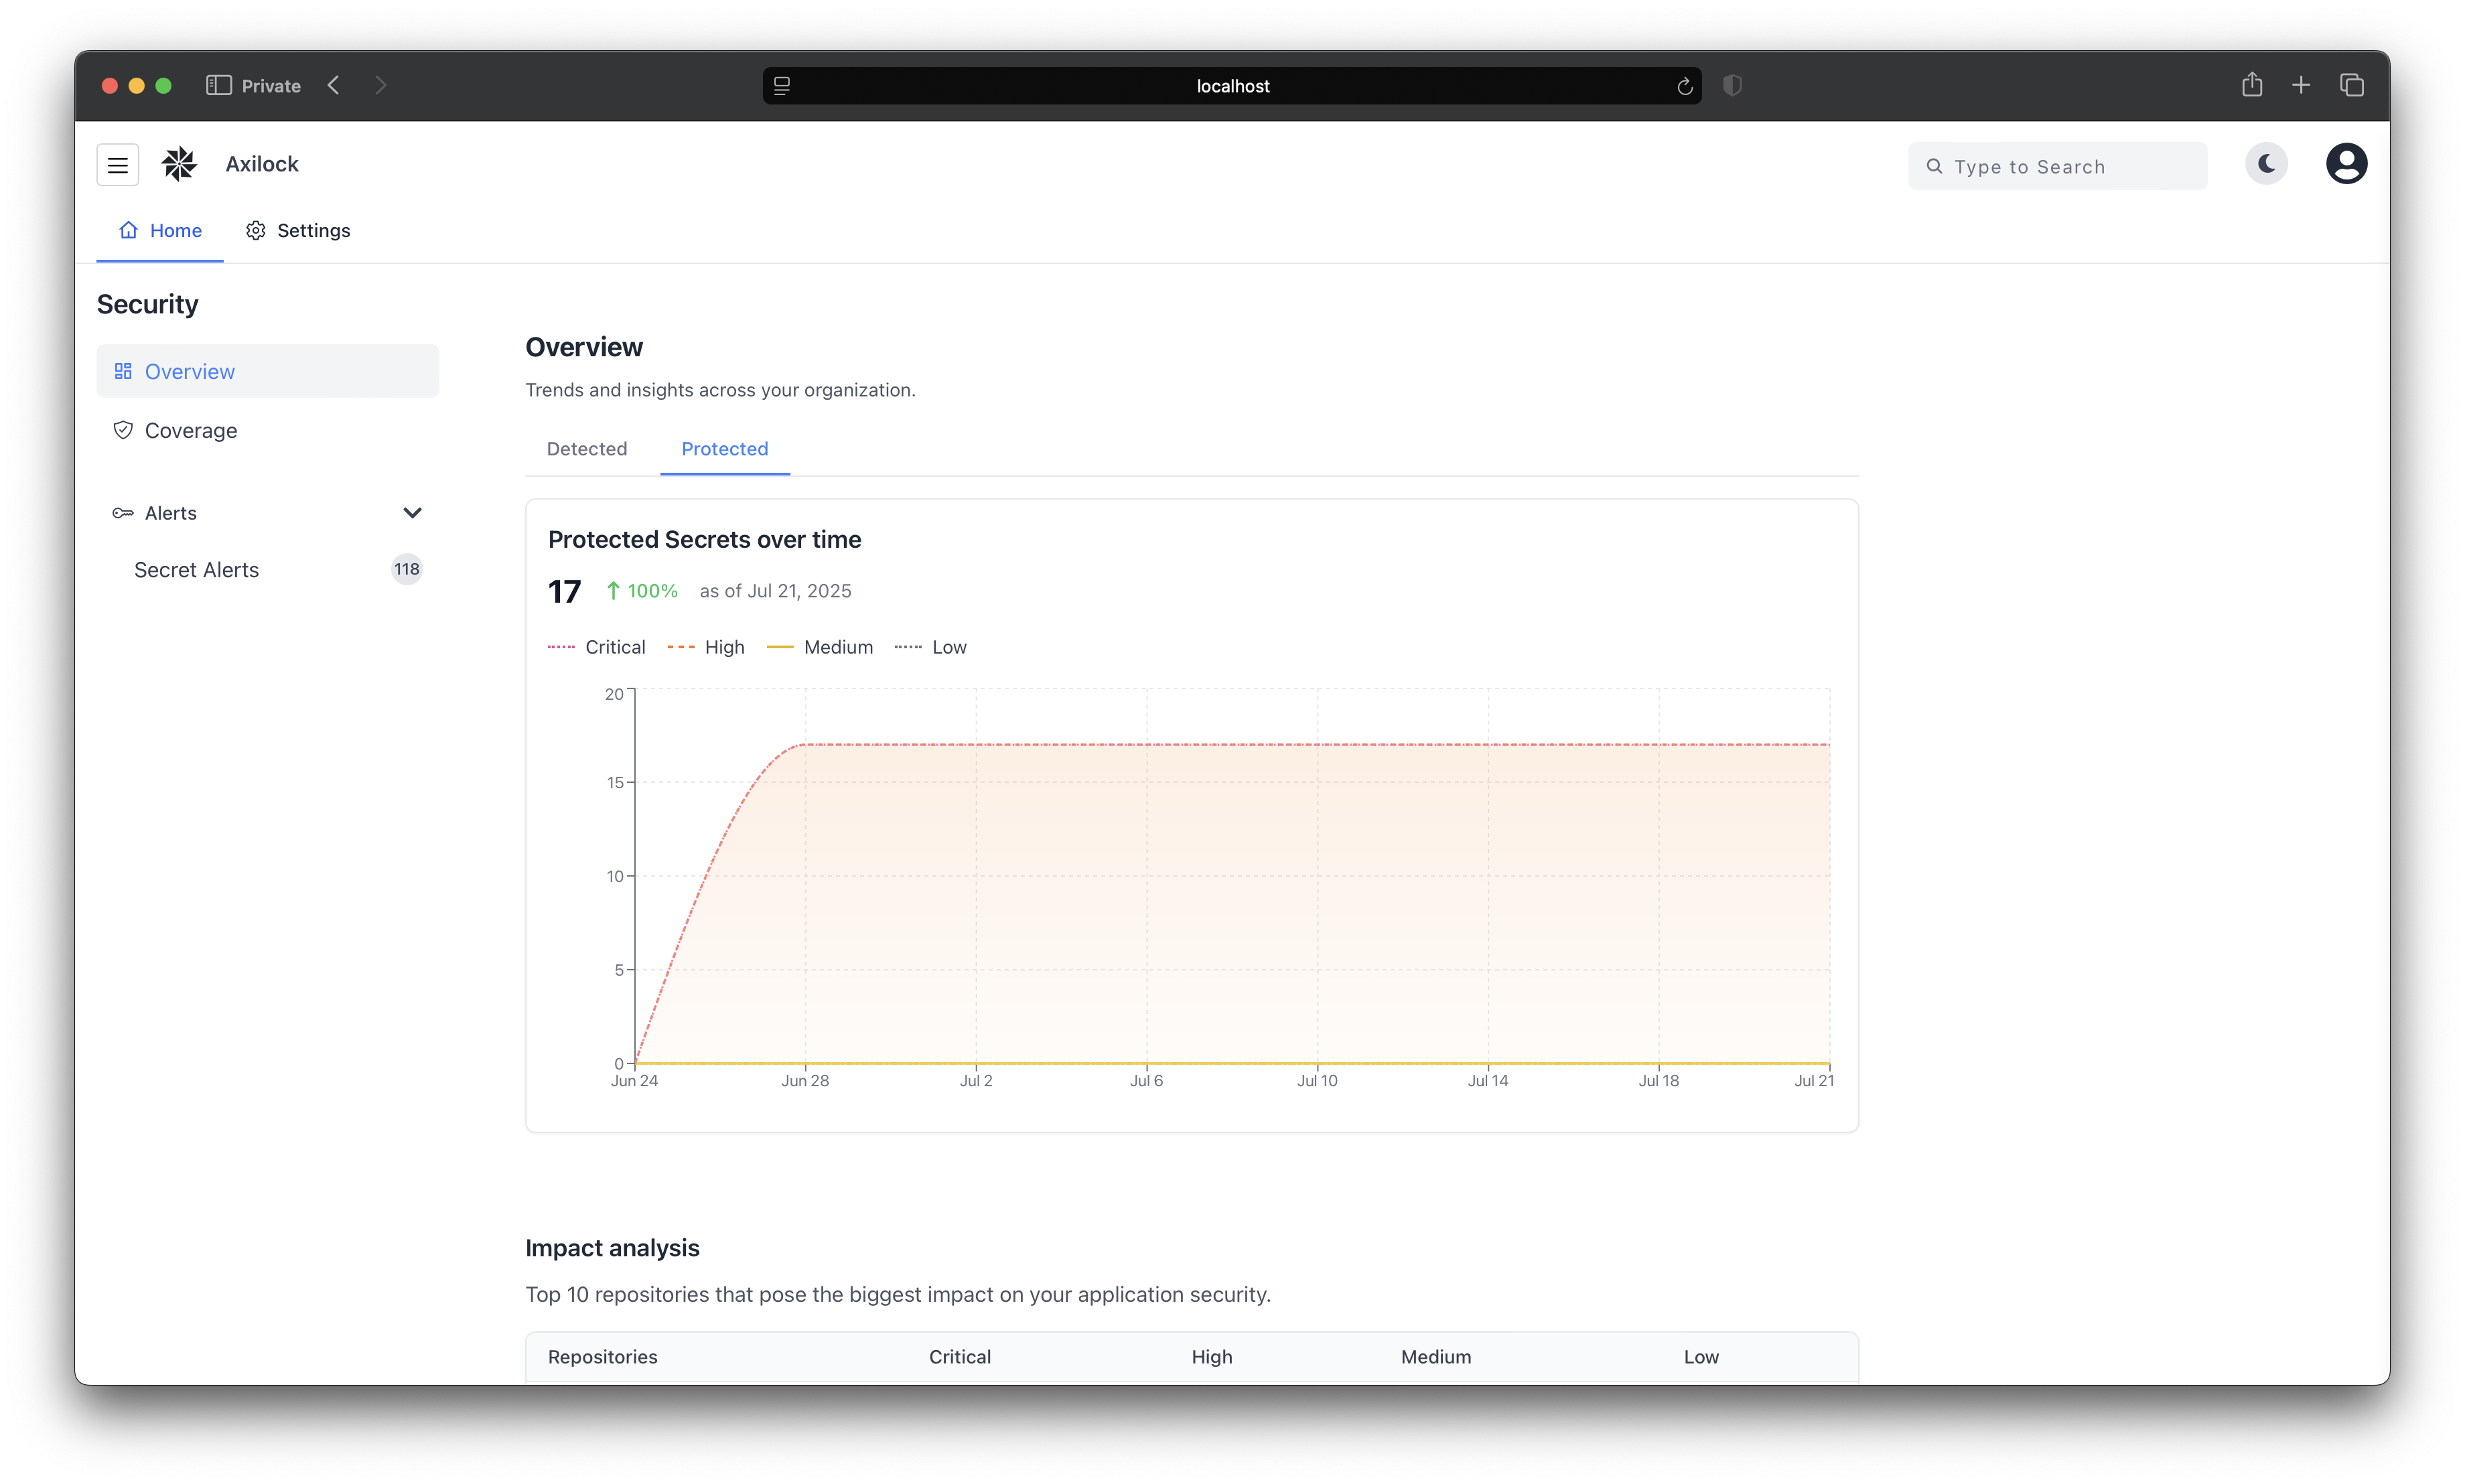
Dashboard
Security metrics dashboard displaying organization-wide security status.
- Line charts showing positive metrics of secrets protected in your organization over time
- Security issues categorized by severity (Critical, High, Medium, Low)
- Top repositories with identified security risks
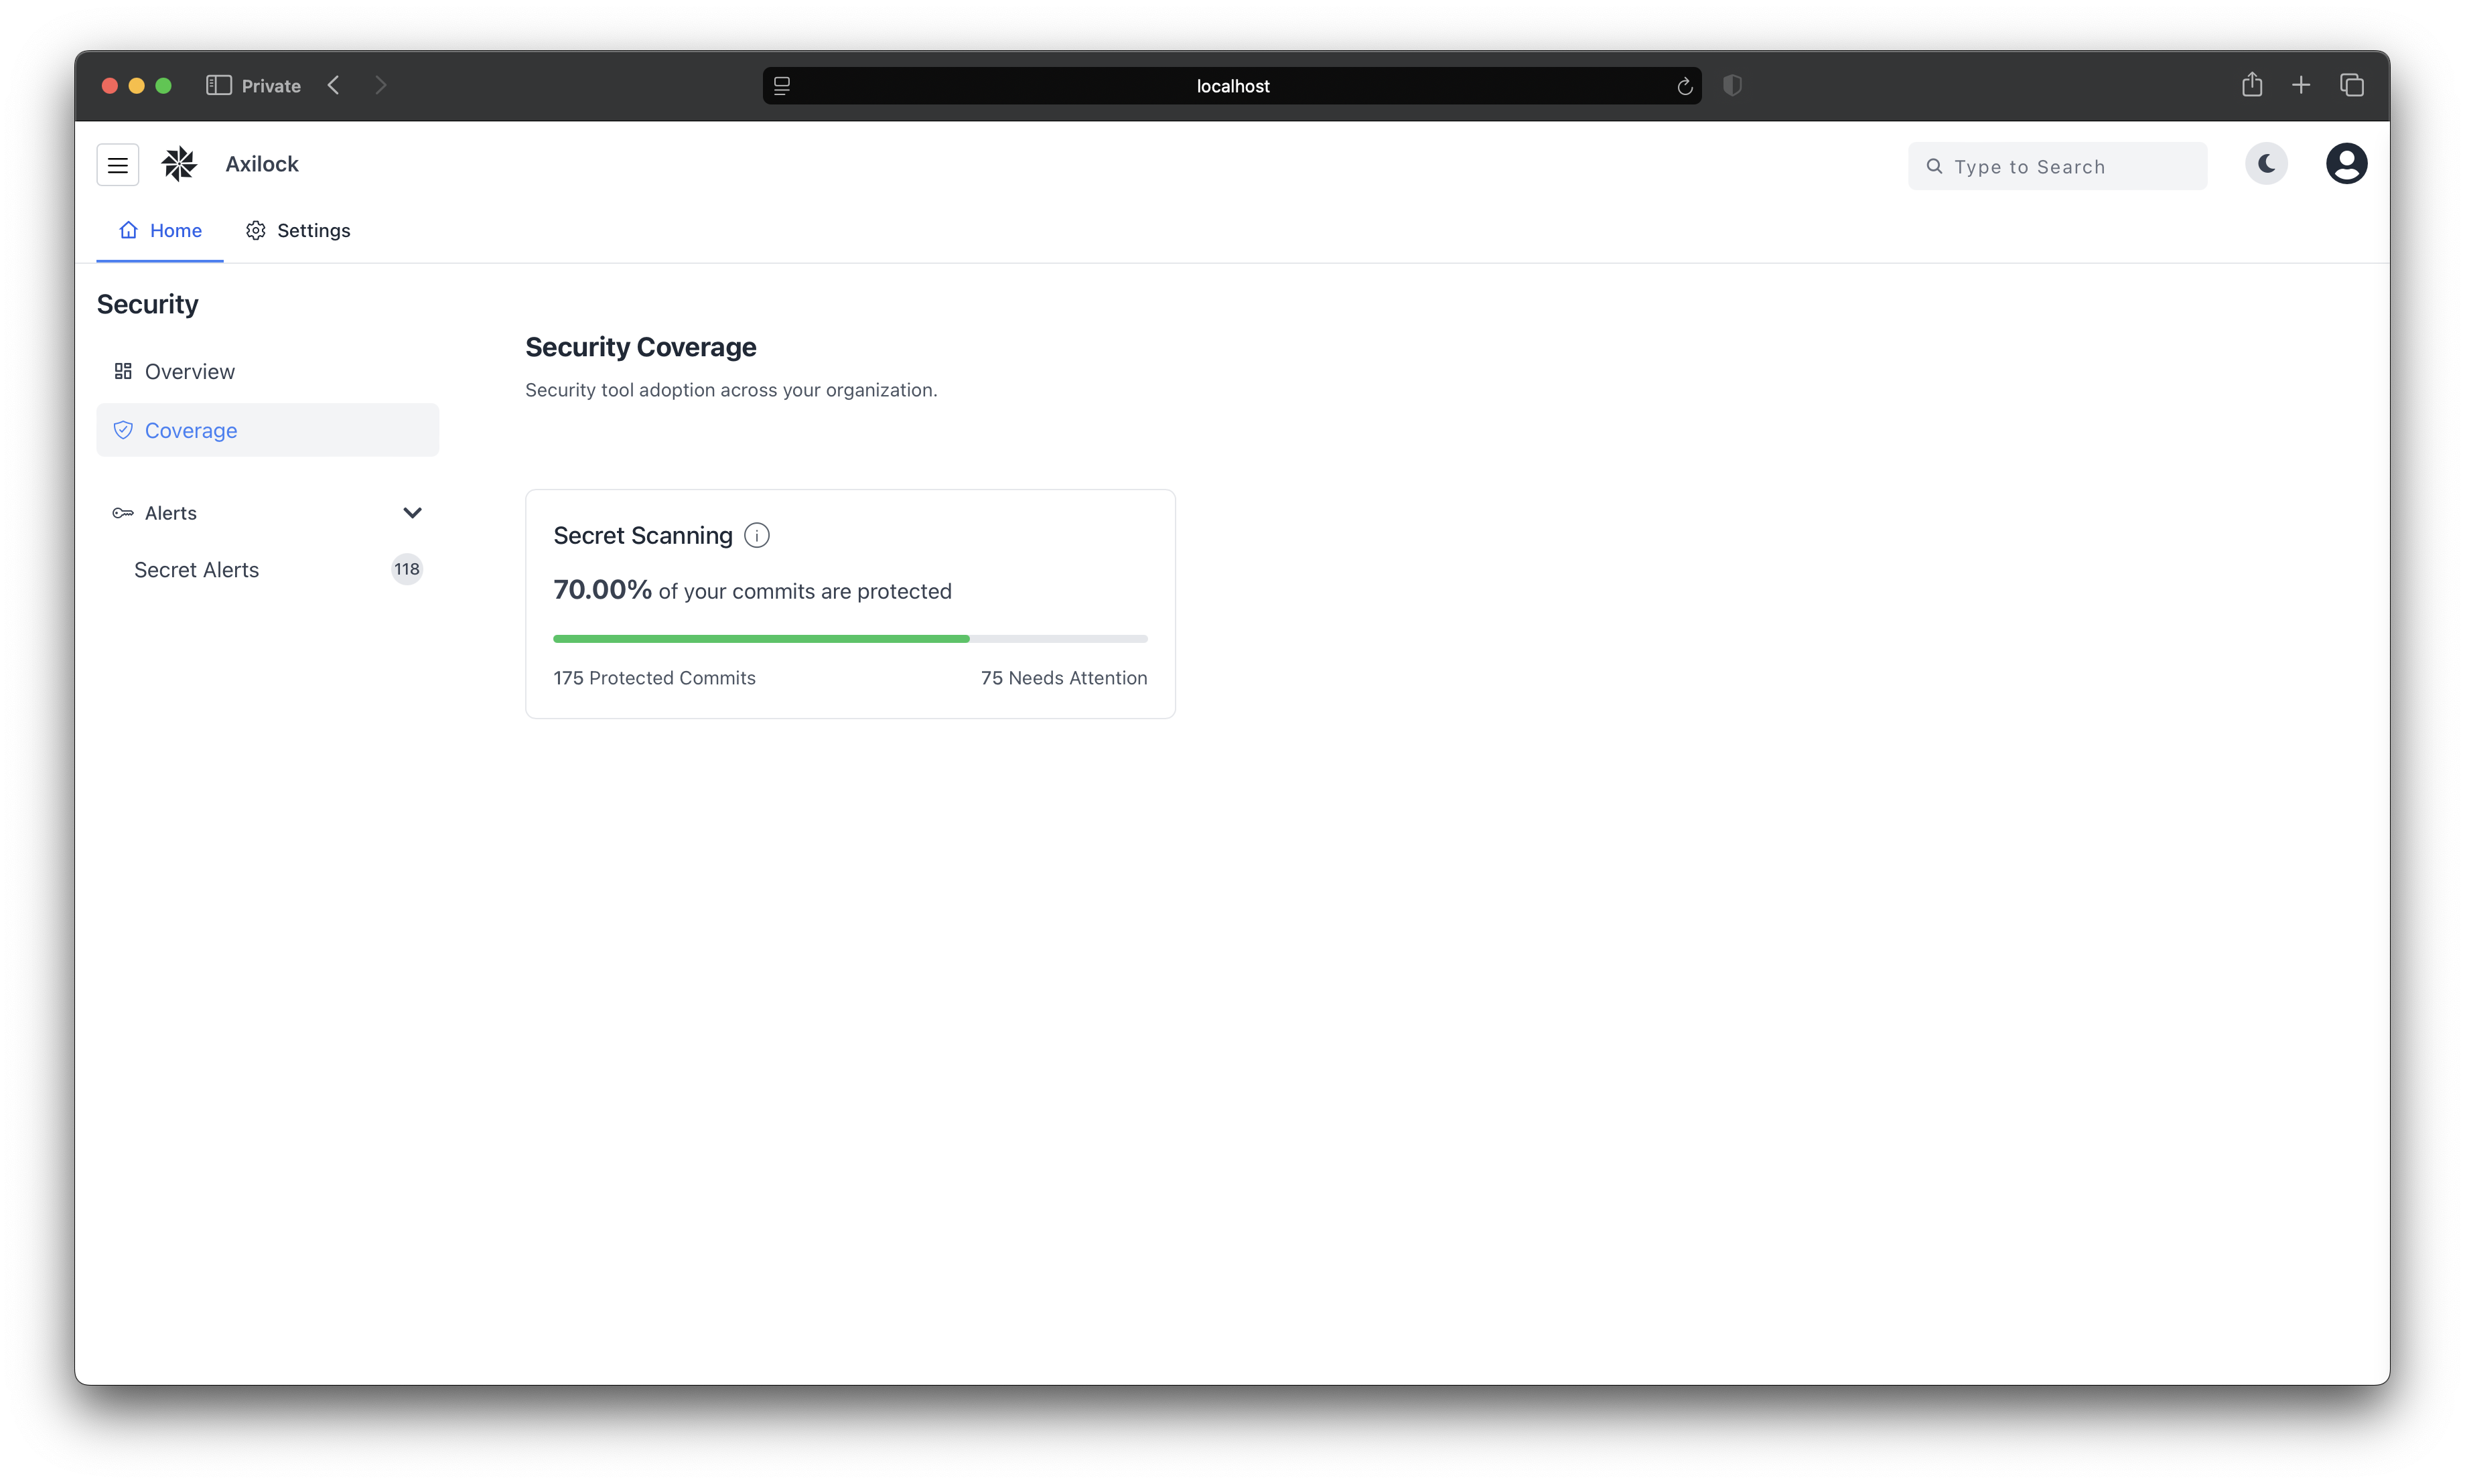
Coverage Page
Security coverage monitor displaying protection status across the organization.
- Protected vs. unprotected commits percentage (commits made using the AXI client are protected)
- Axi client adoption metrics across teams
- GitHub users in your organization not using the AXI client (useful for improving adoption rates)
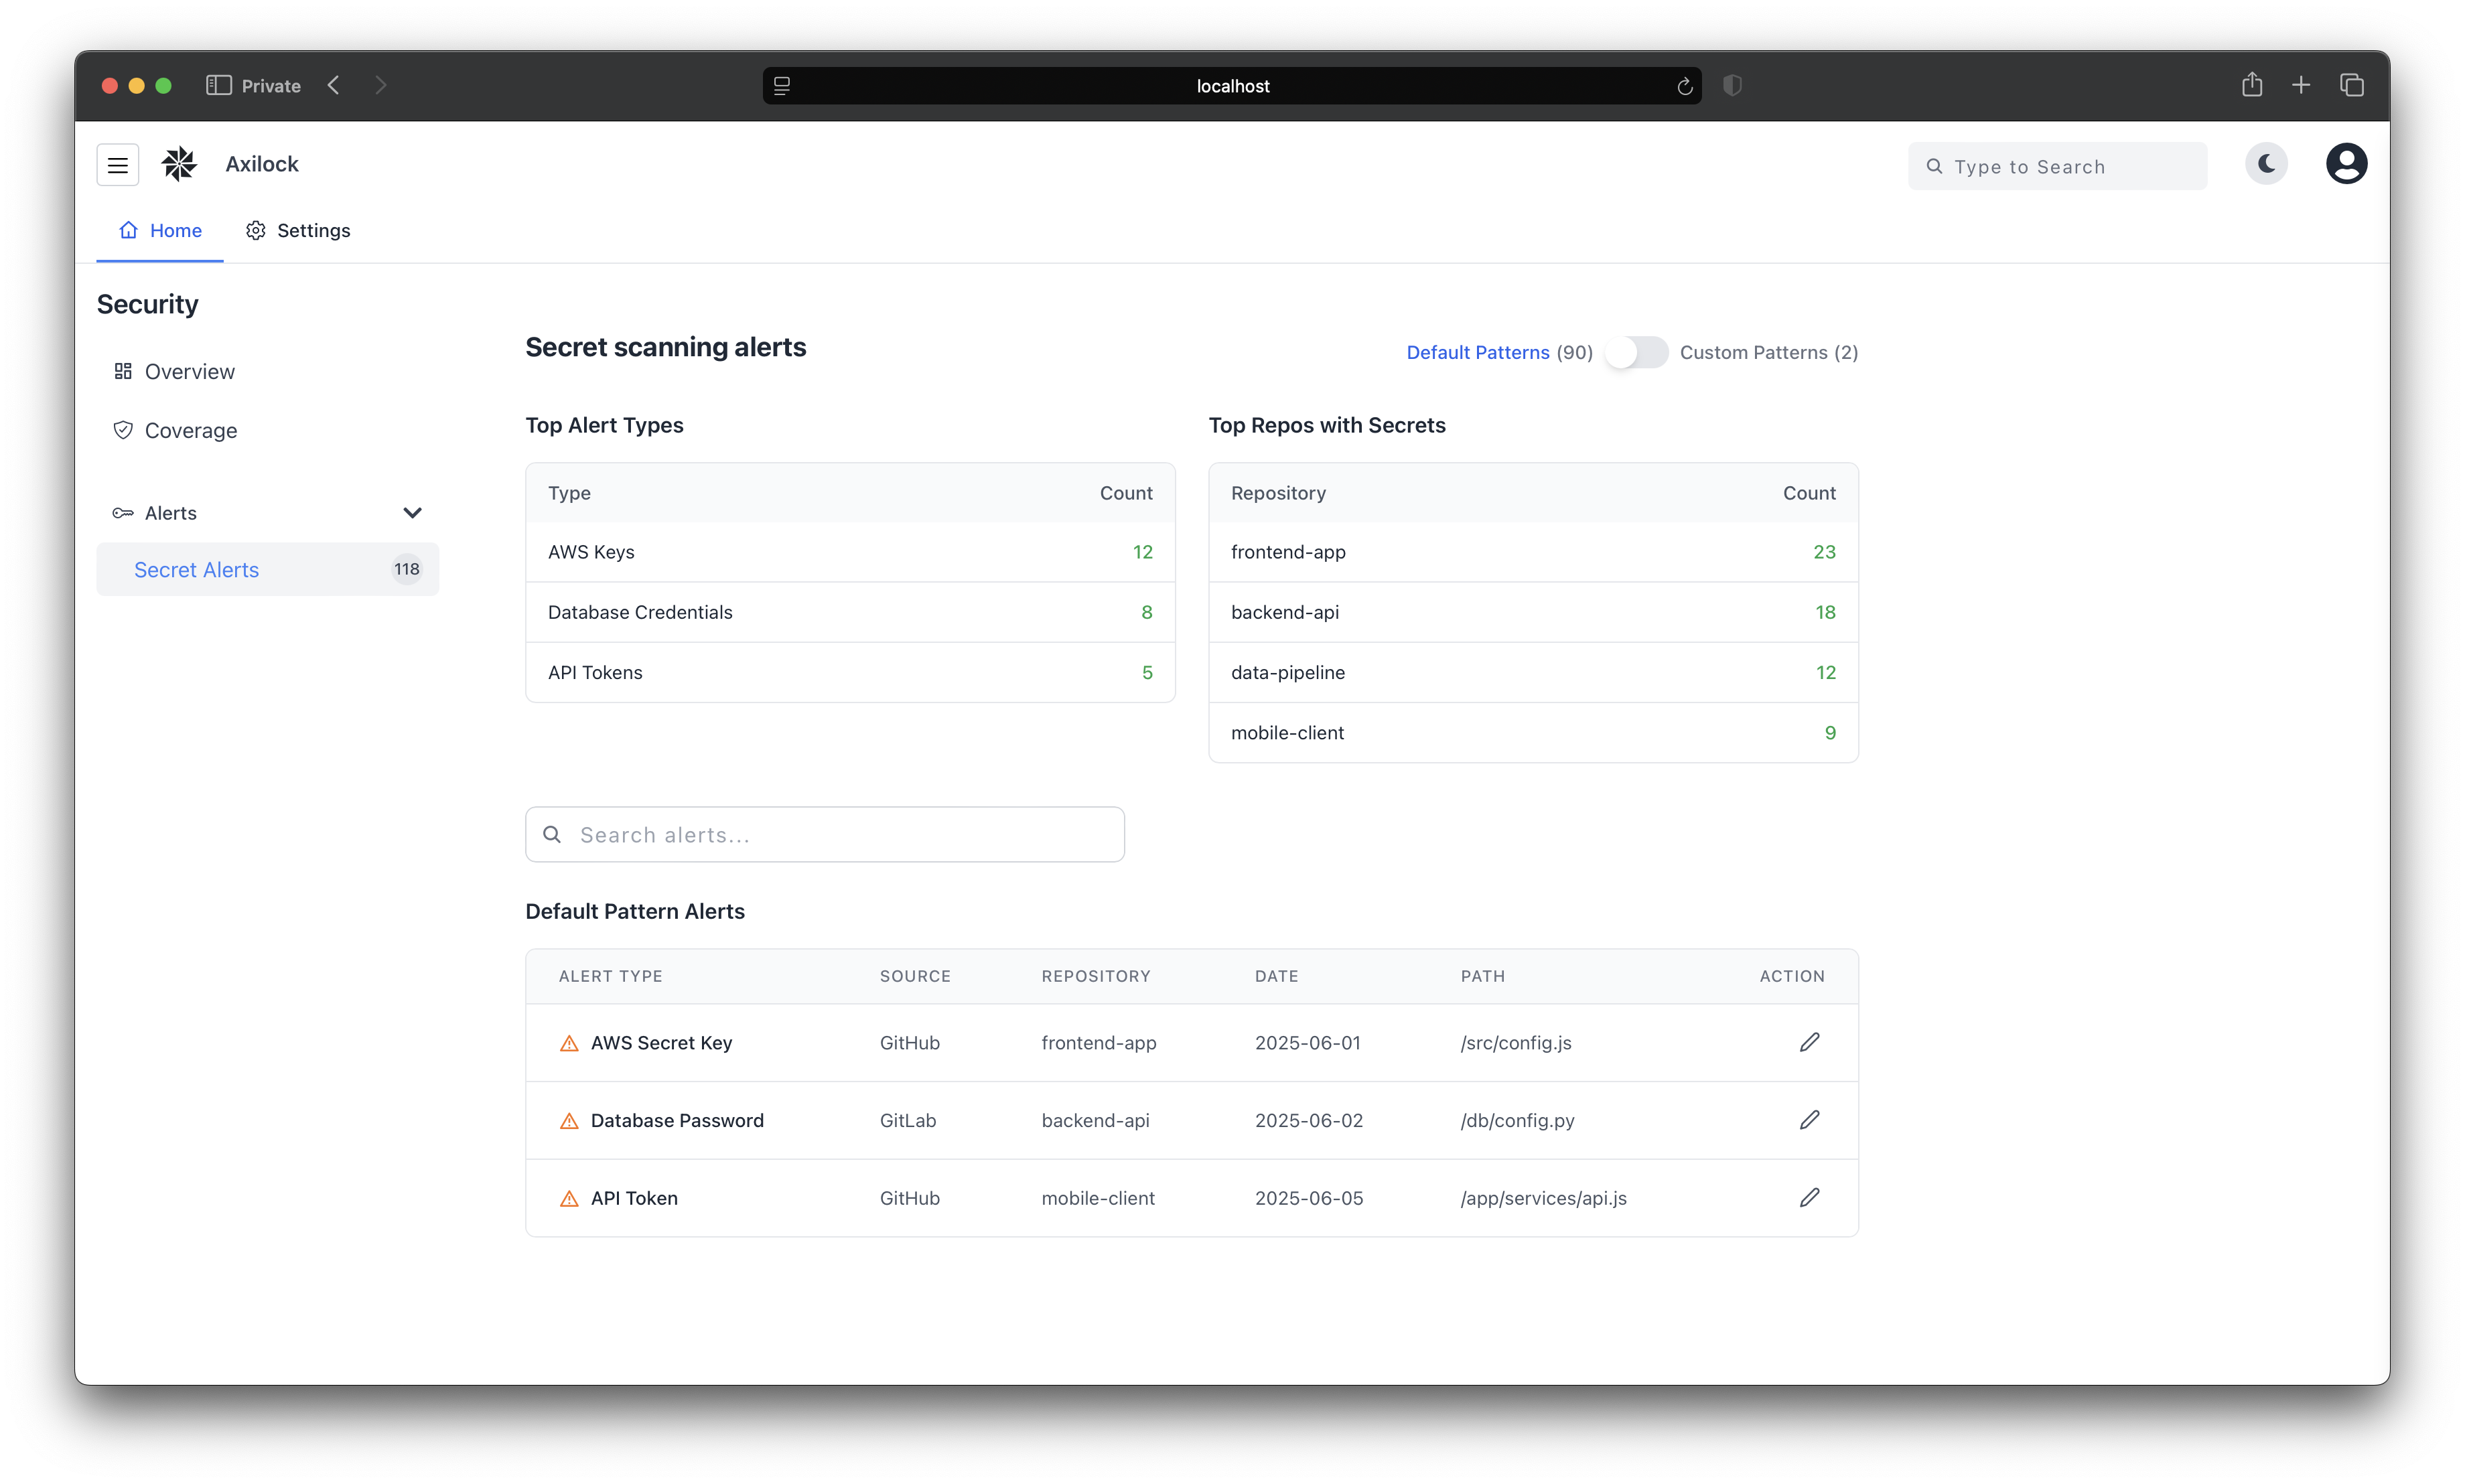
Alerts Page
Security alerts dashboard for secret detection and management.
- Most commonly detected secret types in your organization (helpful for targeted training and solutions)
- Top repositories where secrets are being committed (can inform targeted team training initiatives)
- Detailed alert information including source, repository, and file path
- Count of secrets protected by default and custom patterns